Chart of the Week – 28/06/2023
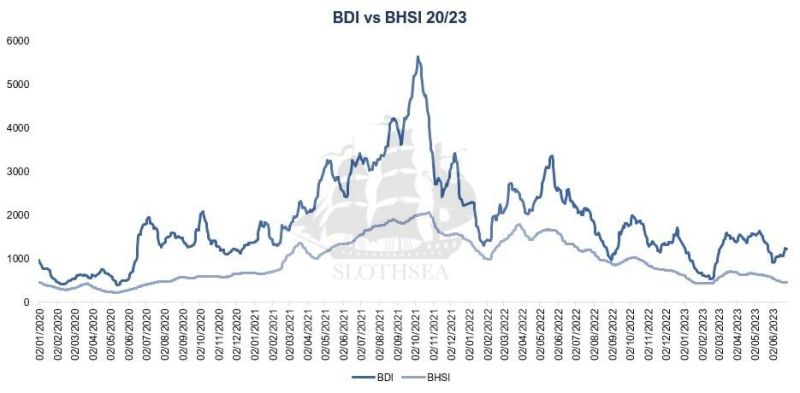
In the chart below we can note as in the last years the Handysize index curve did not help much to drag the general index

In the chart below we can note as in the last years the Handysize index curve did not help much to drag the general index

In 2022, 38 ships were lost globally, implying an improvement over 2021, when total losses were 59. Overall, total losses have dropped more or less

In just two years, lots have changed in the container market, one issue at a time the field faced all the issues, and now yet
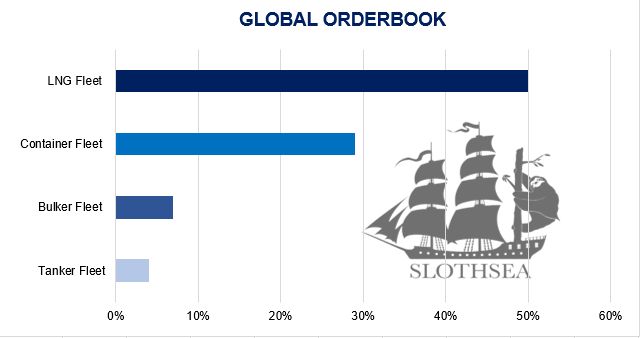
The global orderbook currently stands equivalent to a “moderate” 10% of fleet capacity, though varies significantly by sector, according to the latest data from Clarksons
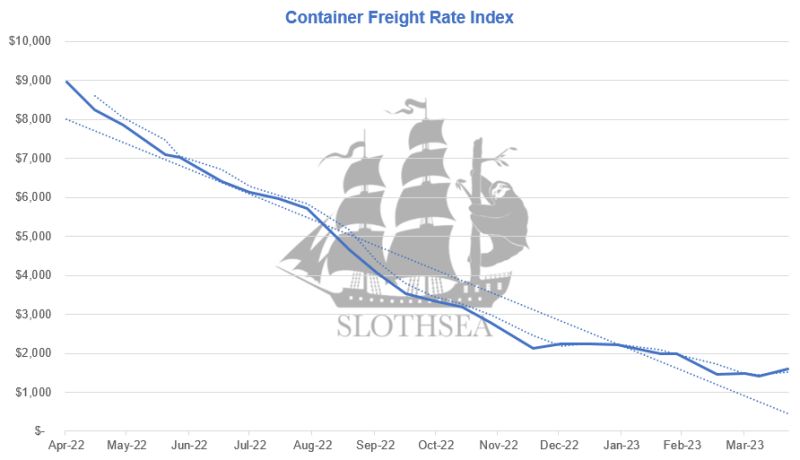
24/06/2023 After one year the container freight market has severely changed as shown in the chart. The index denotes some 82% reduction in the global
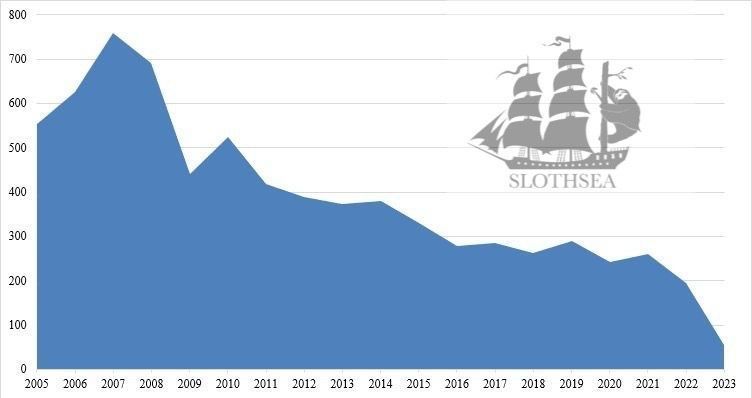
Is interesting to note how the global orderbook is decreasing in the last 20 years. If it wasn’t for the heavy push of the container