Did you know…? – 10/04/202
Did you know that France and Germany are the two largest producers and exporters of grain products belonging to the European Union? Respectively with average

Did you know that France and Germany are the two largest producers and exporters of grain products belonging to the European Union? Respectively with average
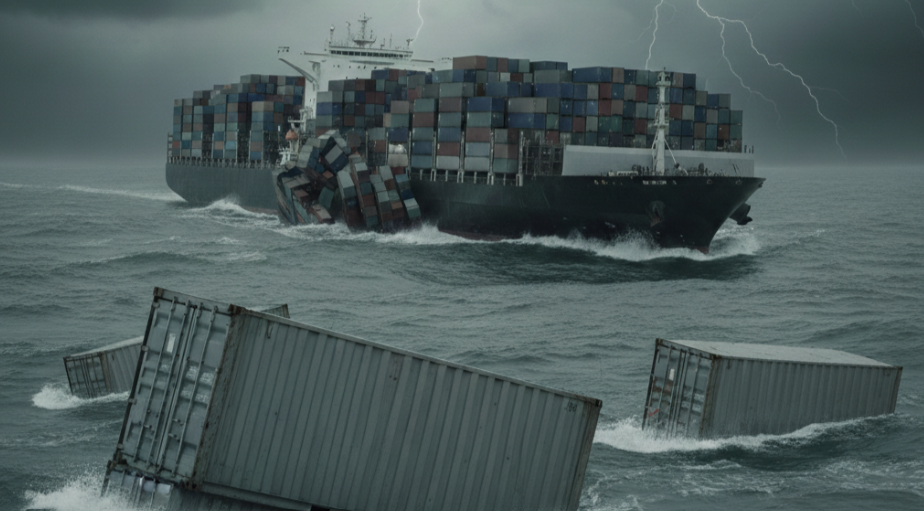
Did You Know? According to the EMSA (European Maritime Safety Agency) in the 2014-2022 time span, the number of marine incidents has been fairly constant
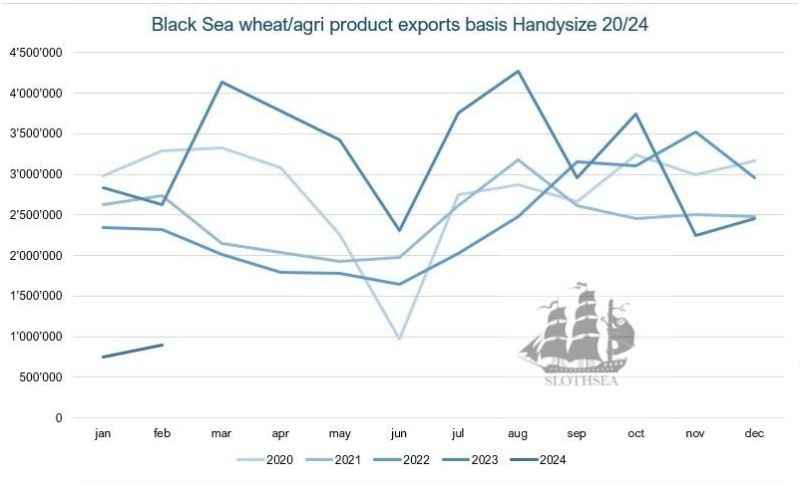
In the chart of SlothSea we can note as the greater peaks of descent for the exports of grains usually take place close to the
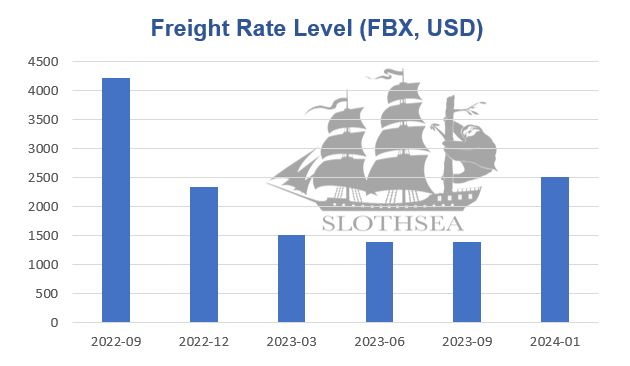
After a calm 2023, characterized by a low and static market from March till November, the new Red Sea crisis shocked the charts almost doubling

Did you know that about 65 million containers are estimated to be currently in use around the world? If lining them up, it would be

Despite being home to one of the biggest ports in the world, The Netherlands is not the country with the most TEU handled per year
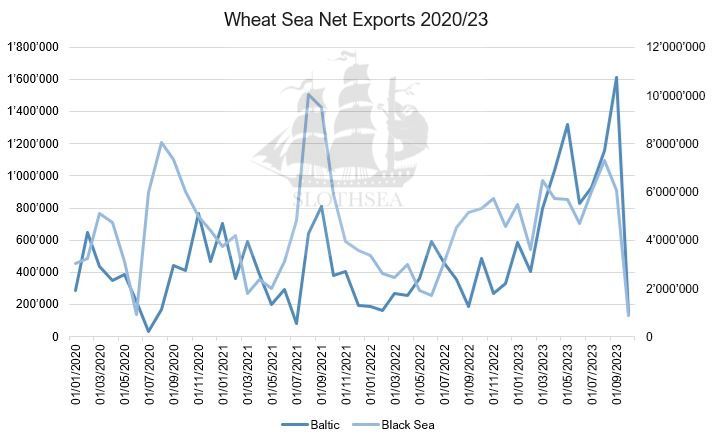
It is interesting to note that wheat exports (in the chart below, in terms of Metric Tons) remained low in the early periods of the
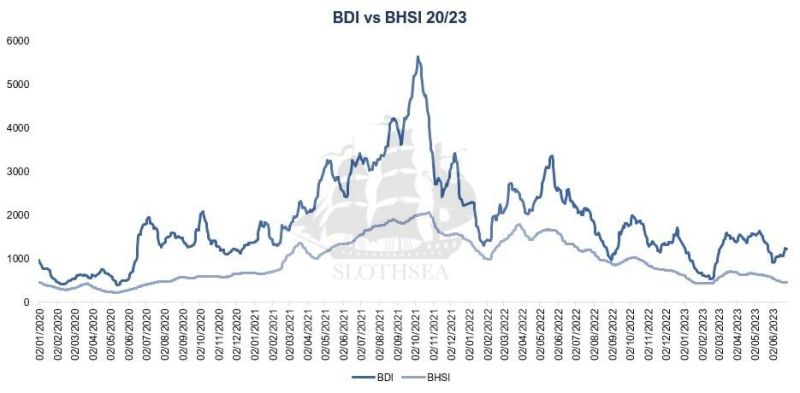
In the chart below we can note as in the last years the Handysize index curve did not help much to drag the general index
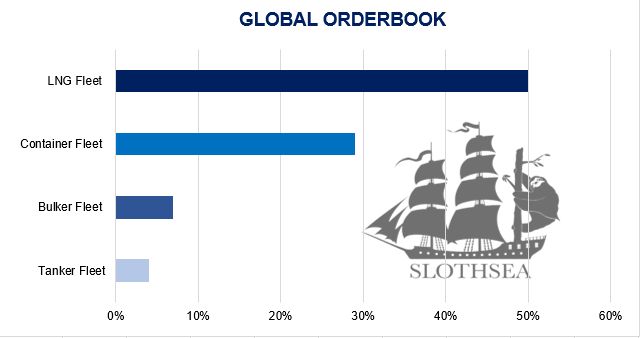
The global orderbook currently stands equivalent to a “moderate” 10% of fleet capacity, though varies significantly by sector, according to the latest data from Clarksons
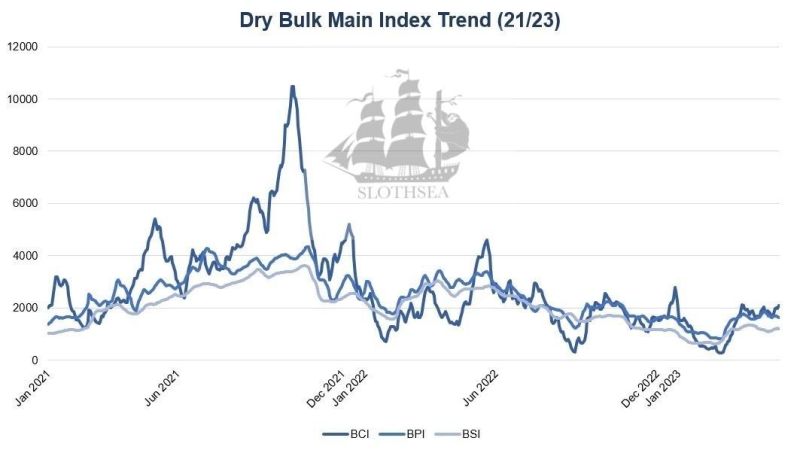
Below a clear vision of the main Index trends of the Dry Bulk market. The Cape segment seems to have prevailed during 2021, but we
