

The global energy landscape has faced extreme turbulence over the last fifteen days, driven by the escalating military tensions involving the U.S., Israel, and Iran. Central to this volatility is the heightened threat to the Strait of Hormuz, the world’s most critical maritime chokepoint. With approximately 20% of global oil consumption transiting these narrow waters daily, any military posturing in the region immediately injects a “blockade premium” into energy prices. As conflict risks intensified, market participants witnessed a classic speculative spike, followed by a sharp correction as diplomatic signals emerged regarding the security of the waterway. The most dramatic trend of the last 15 days is the near-total collapse of vessel traffic through the Strait. While the waterway averaged over 150 transits per day in the weeks leading up to the conflict, recent data shows a plunge of approximately 90%.
Major Crude Oil Indexes began to skyrocket following the start of the US-Israel war on Iran on February 28. Brent jumped over 30% in a single week, crossing the $100 threshold for the first time since 2022. In a dramatic reversal, oil prices plummeted more than 11% in a single session on March 10, offsetting – only partially – the major increases of the past days.
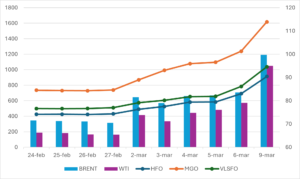
MGO, VLSFO, and HFO, the most common fuel types in the maritime sector, mostly followed the trend of major crude indexes, reaching record levels in a few days. In particular, the BIX World 3 Index by fuel type (unweighted simple averages of all spot port prices in Singapore, Rotterdam and Fujairah (the largest bunker ports in Asia-Pacific, Europe and the Middle East, respectively) climbed more than 100% in just a few days, with MGO jumping from 740 USD per metric tonne during the last week of February to 1.616 USD on March 9th. Brent and WTI indexes, on the other hand, faced a smaller increase, considering that the opening USD price per barrel jumped from 66-71 USD to 95-99 USD, yet with intra-day maximums around 120 USD per barrel.
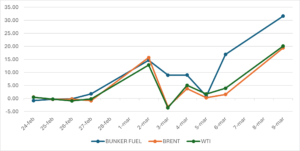
As already stated above, the next chart highlights the different price evolution of major crude oil indexes against the average increase of the most common fuel types. The chart underlines the different trends, especially between March 5th and March 9th, where the price increase difference reached a staggering 15%. This means that bunker prices spiked significantly more than global crude oil prices, highlighting how scared the market was of a major supply disruption related to the blockage of the Strait of Hormuz.
Was the same increase also experienced by LNG? Only partially, with weekly increases just around 45% and 55%, halving the average bunker fuel price increase of the last 15 days.
As the recent market correction is still not reflected on the global bunker indexes, it will be interesting to understand if the decrease will be steeper, aligned, or weaker than the global crude oil trends, as this will reinforce the sentiment of investors on the effects on the global energy market.